Kontaktaufnahme

Live-Chat mit Tektronix-Vertretern. Verfügbar von 9 bis 17 Uhr CET Geschäftstage.

Anrufen

Kontaktieren Sie uns telefonisch unter

Verfügbar von 9 bis 17 Uhr CET Geschäftstage.

Download

Laden Sie Handbücher, Datenblätter, Software und vieles mehr herunter:

DOWNLOADTYP
MODELL ODER SCHLÜSSELWORT

Blog: #SPECTRUM ANALYZER

Einträge

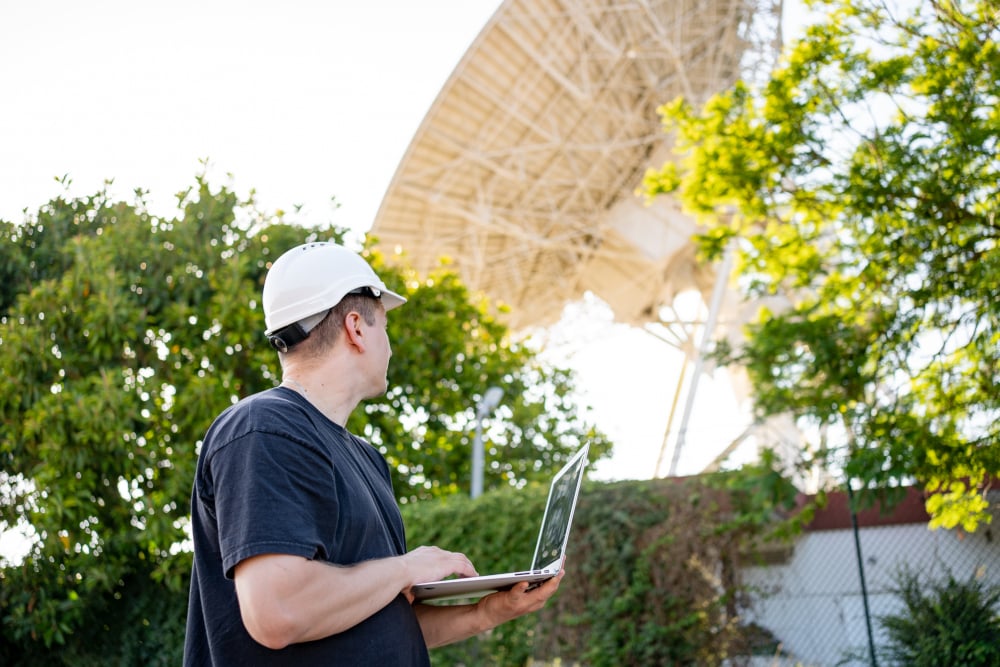
An RF engineer performing spectrum monitoring via a laptop PC while observing a radar system.
Capture Elusive RF Signals with Advanced Software for Handheld Spectrum Analyzers Tuesday, November 26, 2024
RF signals are more dynamic and unpredictable than ever, which presents new challenges for engineers. Even traditional vector spectrum analyzers struggle to capture transient or intermittent signals, leaving you without a complete picture of how your circuit or system is performing. Tektronix SignalVu-PC software now provides three advanced triggers enabling you to visualize, capture, and analyze …
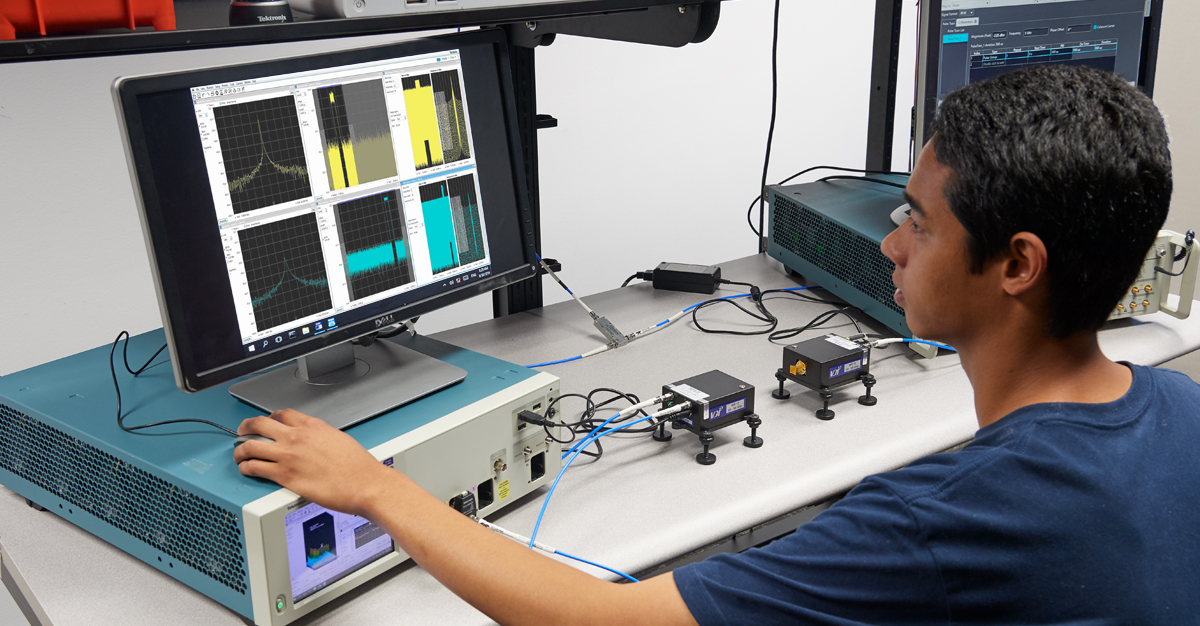
Wideband Oscilloscopes for MIMO radar testing being used by and engineer.
MIMO Radar System Testing Tools and Techniques Thursday, January 11, 2024
Modern technologies such as MIMO require the need for wide bandwidth, phase coherent, multi-channel analysis. Antenna elements in a MIMO radar system operate independently to cover a wide, often 180-degree, field of view without the need for directivity adjustments. This significantly improves scan times. The MIMO radar employs time, frequency, or coding techniques in each transmit signal to …
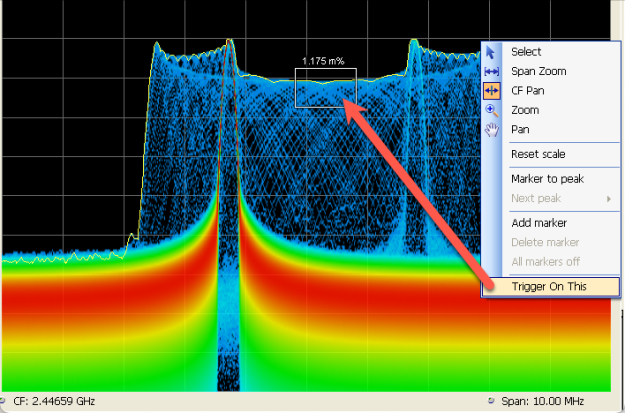
Setting up a DPX density trigger box in frequency and amplitude
Separating RSA Facts from RSA Fiction Wednesday, July 5, 2023
Researchers, engineers, and technicians working on RF applications generally have a good grasp on the use and benefits of spectrum analyzers, whether they are traditional swept spectrum analyzers (TSA) or more modern vector signal analyzers (VSA). They understand the key specifications and principles of operation of these important RF instruments. However, sometimes they are puzzled by a slightly …
Spectrograms show spectral activity over time with amplitude indicated by color
Spectrogram Types: The Many Faces of the Spectrogram Tuesday, November 15, 2022
What is a Spectrogram A spectrogram is a graphic that shows the viewer how the frequency domain content (spectral content) of a signal or signals is changing or progressing over time. It consists of a collection of spectrum traces that are collected/processed over time and stacked next to each other, much like slices of bread in a loaf. While each individual spectrum trace would be on the “butter …
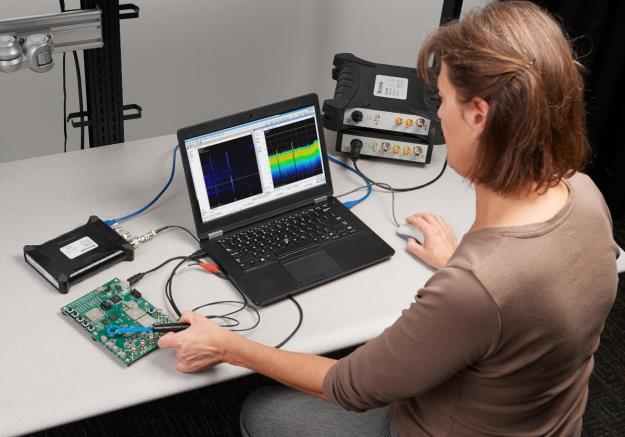
EMI application
Building Your Own EMI Troubleshooting and Pre-Compliance Kit Monday, October 17, 2022
Dylan Stinson, Product Marketing Manager at Tektronix, recently penned an article for the Interference Technology’s 2022 EMC Testing Guide: How to Build Your Own EMI Troubleshooting and Pre-Compliance Kit. We wanted to share some of the key insights here. Failing EMI/EMC compliance testing can certainly ruin a design engineer’s day. The costs and time delays associated with a failed test can add …
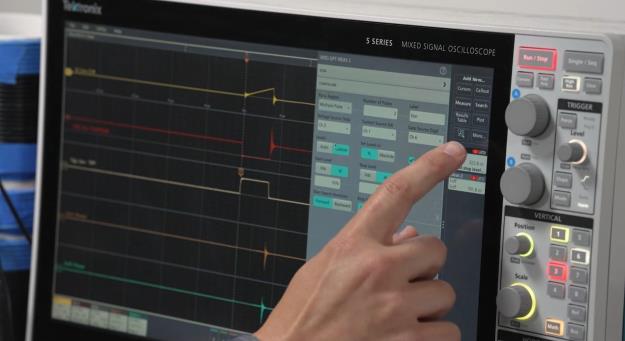
Tektronix touchscreen oscilloscope.
Are You Keeping Pace with Wide-Bandgap Test Requirements? Tuesday, September 13, 2022
A new generation of wide-bandgap (WBG) materials such as silicon carbide (SiC) and gallium nitride (GaN) are becoming more prevalent. Electrically, these substances are closer to insulators than silicon and other typical semiconductor materials. Their adoption is an effort to overcome limitations of silicon that stem from it being a narrow bandgap material, which leads to undesirable conductive …
DPX Display
Overcoming 3 Challenges of Time and Frequency Correlated RF Measurements Thursday, June 16, 2022
Historically, engineers working with high-frequency signals have relied on spectrum analyzers to identify, characterize, and test the performance of their designs, devices, and systems. But these devices fall short when analyzing signals with an unpredictable time-related behavioral component. Tektronix Real-Time Spectrum Analyzers (RTSAs), however, capture and store signals as a seamless …
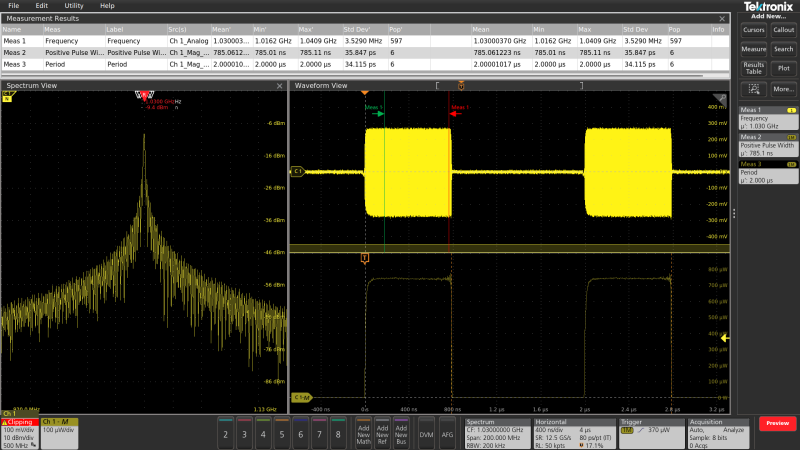
A graphic user interface displaying RF frequency trigger on wireless burst signal
Spectrum View: A New Way of Analyzing Signals Across Multiple Domains Tuesday, December 14, 2021
Analyzing Signals Across Multiple Domains There is increasing interference in the RF domain as we work to make IoT devices more powerful, consume less energy and have longer battery lives but still broadcast high-quality RF communication. From smart watches to heart rate sensors, the devices being designed today are getting smaller and smaller, which makes signal integrity more important than ever …
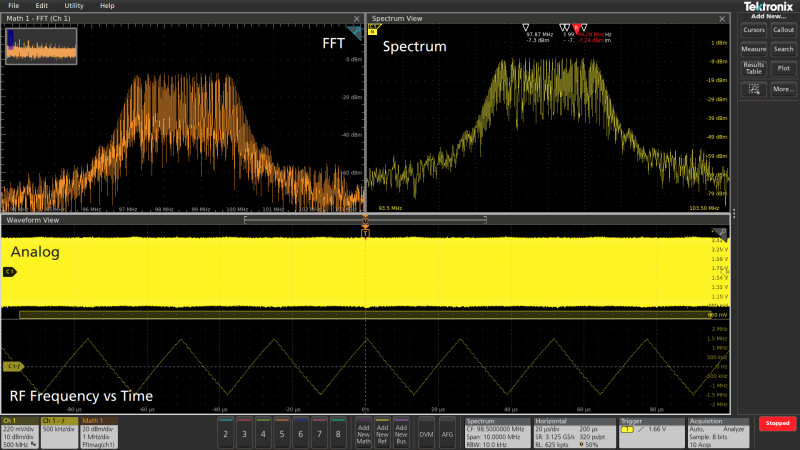
A graphic user interface displaying FFT optimized vs Spectrum View.
How to Use Spectrum View for Easier, More Accurate Insights Tuesday, December 14, 2021
Efficient system analysis and debug relies on insights but correlating signals across multiple domains has traditionally been a painful, technically challenging process. It can be difficult to figure out why a system isn’t working as expected without precise, synchronized insight into both time and frequency domains. Spectrum View was created to solve that challenge. The 4, 5 and 6 Series MSO …
Radar emitting ships interact with each other
3 Radiation Hazards (RADHAZ) and How to Mitigate Risk Wednesday, September 8, 2021
If you are involved in military, aerospace or defense and have been around radar and communication systems, with high-power RF transmitters and high-gain antennas, you are probably aware of the many risks associated with Radio Frequency Radiation (RFR) Hazards. RF emissions from these systems have the potential to cause catastrophic damage to operations and maintenance personnel, ordnance and …